

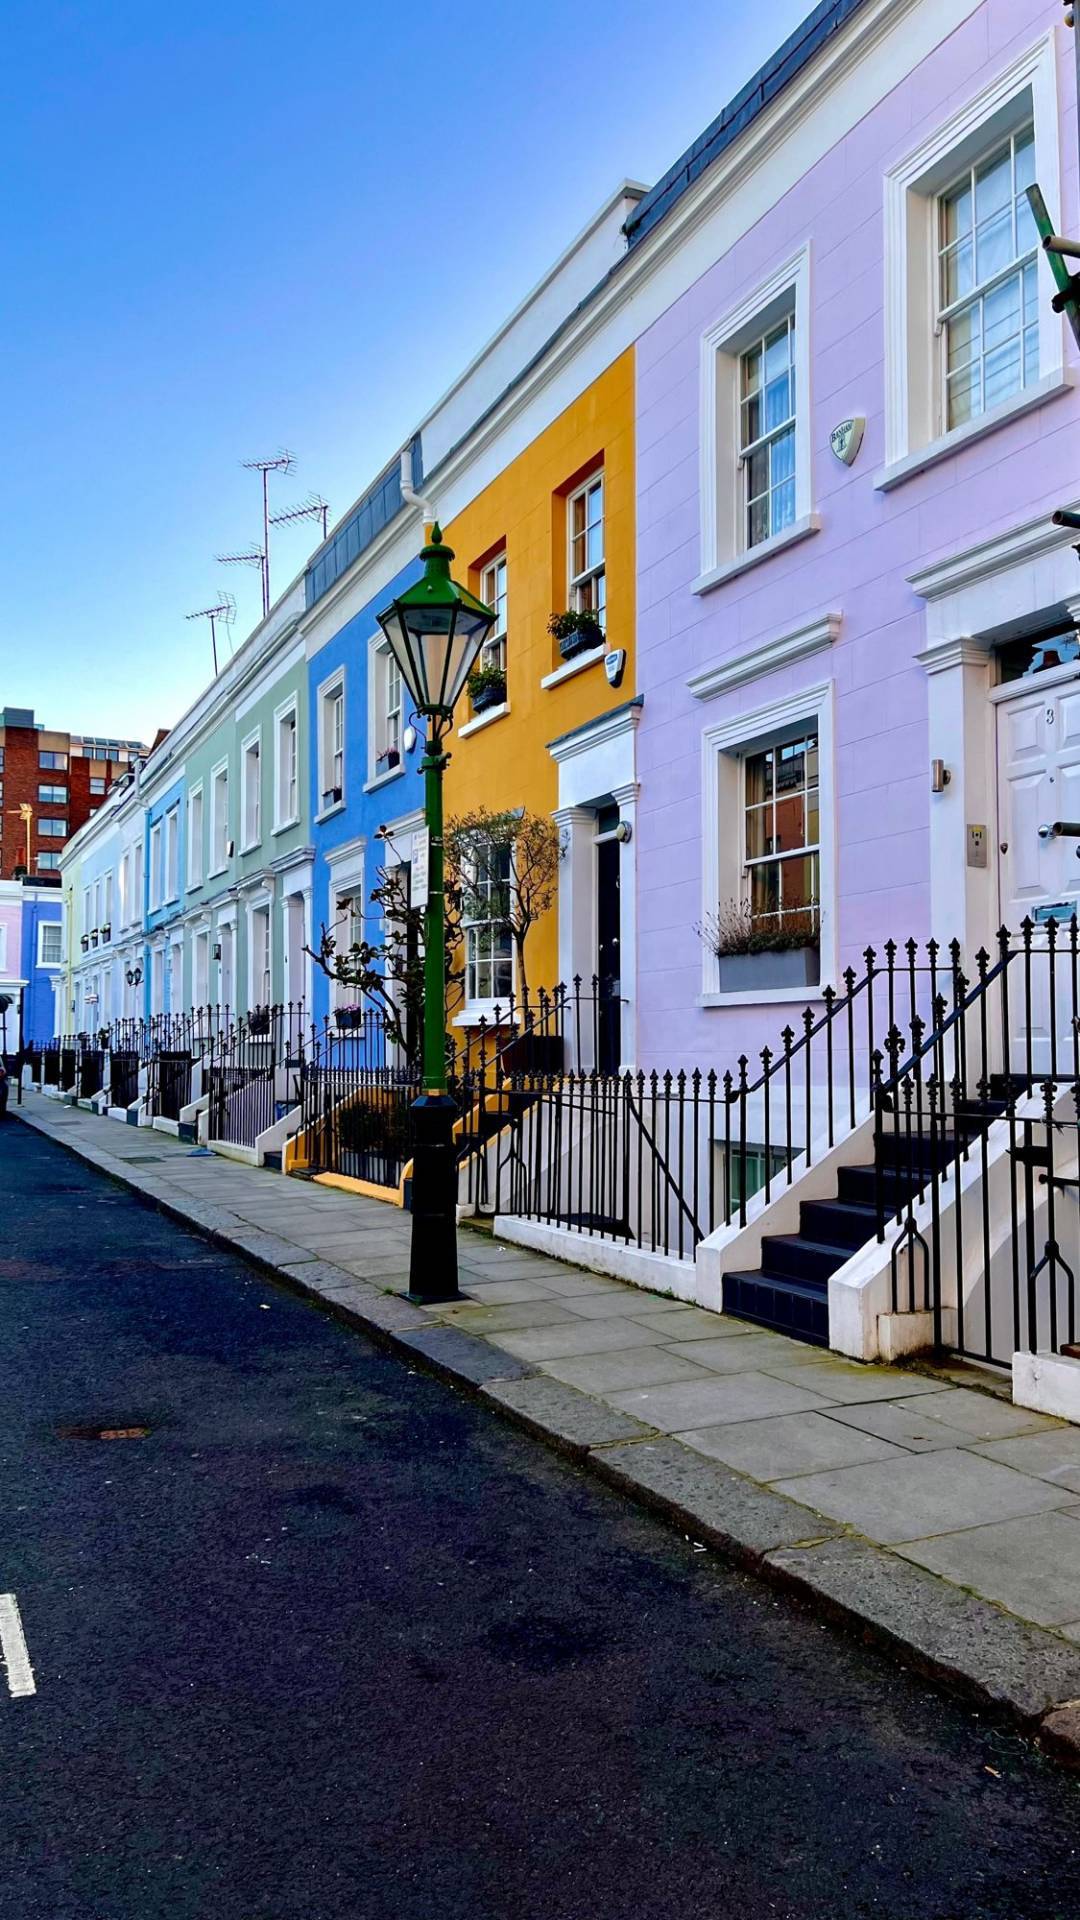
Prime London districts are moving at different speeds this autumn, and the gap between them is wider than the headline indices suggest. Benham and Reeves's Prime London Demand Index, which tracks the share of homes for sale in each area that have found a buyer, shows demand easing between £2 million and £10 million in the third quarter while rising slightly above £10 million. Underneath those totals, individual districts went sharply in both directions.
For a buyer comparing Hampstead with Holland Park, or Mayfair with Belgravia, those differences shape how much competition to expect and how much room there is to negotiate.
The overall picture
On Benham and Reeves's figures, reported on 2 October, 13.2% of homes listed between £2 million and £10 million had found a buyer in the third quarter, down from 14.5% in the second. Above £10 million the figure was 4.3%, up from 3.7%. Rightmove's index, published this morning, shows London asking prices up 2.5% in October but 1.7% lower than a year ago, with more homes for sale across Great Britain than at this time of year since 2014. LonRes's figures for July to September recorded an average discount of 12.6% between initial asking prices and achieved prices in prime central London.
Between £2 million and £10 million
The strongest demand remains in the family markets of south-west and west London. Clapham had the highest share of homes finding a buyer, at 42.7%, followed by Wandsworth at 41.5%, Islington at 37.2%, Chiswick at 31.3% and Richmond at 28.2%.
The biggest increases on the previous quarter were in Fitzrovia, up 5.4 percentage points, Islington (4.8), Canary Wharf (4.5), Maida Vale (4.0), Hampstead (3.0) and Mayfair (2.0), with smaller rises in Pimlico, Marylebone and Knightsbridge. Demand fell most in Chiswick (down 6.5 points), Clapham and Belgravia (both down 4.9), Putney (4.5), Holland Park (3.6) and Wimbledon (3.4). Clapham and Chiswick are therefore still among the most competitive districts, but less so than in the spring.
Above £10 million
At the top of the market, the biggest increases were in Mayfair, up 5.1 points, Notting Hill (4.3), Victoria (3.1), Belgravia (2.2) and Kensington (1.5). Demand fell in Highgate, St John's Wood, Marylebone and Chelsea. Knightsbridge, at 8.8%, and Chelsea, at 6.7%, were among the districts where the highest share of homes found a buyer.
These figures need care. Very few homes are listed above £10 million in any one district, so a single sale can move a percentage a long way. They are a guide to direction, not a measure of value.
What the official figures add
The Office for National Statistics publishes average prices by borough from HM Land Registry data. Its provisional figures for July 2026, released on 16 September, put the average price in Kensington and Chelsea at £1,233,000, 14.1% lower than a year earlier, in Westminster at £877,000, down 20.7%, and in Camden at £815,000, down 10.1%, against a fall of 3.3% across London.
Those falls look dramatic, and they should be read with caution. Recent months are provisional and are revised as more sales are registered; borough averages mix flats and houses; and in boroughs with relatively few sales, a change in the type of home that sold can move the average sharply. They do, however, point in the same direction as LonRes's achieved prices: lower than a year ago in central London.
Reading the figures as a buyer
Where demand has eased and discounts are wide, buyers can usually take their time and negotiate against achieved prices for comparable homes. Where demand is high, as in the south-west family markets, well-priced homes are more likely to attract competition, and a buyer who has finance, solicitors and surveyors lined up is better placed. In every district, the street and the building matter more than the borough average.
The Budget on 28 October may bring changes to property taxation, so any announcement should be checked against the expected completion date. Stamp duty, including the surcharges for buyers who own elsewhere or are not UK resident, is covered in an earlier article. None of this is financial advice.
Dolce Vita advises buyers and sellers across the UK from Mayfair, handles lettings, and helps clients buy abroad through partner agencies. If you are selling in order to buy, Request a valuation; we acknowledge the same working day and return a written valuation within 24 to 48 hours.
Hanane Dawson, Founder
Sources: Benham and Reeves Prime London Demand Index, Q3 2026 (via Estate Agent Today, 2 October 2026) and Q2 2026 (via Estate Agent Today, 14 July 2026). Rightmove House Price Index, October 2026, published 19 October 2026 (via Property Reporter, 19 October 2026). LonRes, "London property sales: summer 2026 standouts", 6 October 2026. ONS, "Housing prices in your area" for Kensington and Chelsea, Westminster and Camden (UK House Price Index, July 2026 provisional, updated 16 September 2026).